Improving collaboration and data accessibility is crucial to a business’s success. But, many businesses struggle with making their data easily accessible to employees.
A common challenge is that different departments use their own formats to share data. Creating a single, unified data format helps eliminate siloes and encourages collaboration.
Embedding Dashboards
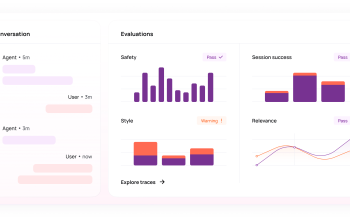
Promote data literacy by helping users understand the meaning behind their charts and dashboards. You can do this by ensuring the data is presented in a clear and logical manner, and providing additional context through comments. You can also encourage data literacy by holding monthly workshops or creating a collaborative Slack channel like ours, Number Munchers, where data newbies share tips and tricks.
When possible, embed your dashboards in the place where they are most relevant to your stakeholders. This is important to ensure that your teams and customers are able to easily access the information they need without having to log in. To further maximize adoption, your embedded dashboards should be simple to embed in any environment and provide granular control over who sees what. For example, you can embed dashboards in your own web portal or application using iFrames and provide role-based permission functionality for easy governance. In addition, you should be able to add a custom color palette for your embeds to match the look and feel of your own application.
Embracing Data Visualization
Data visualization allows teams to unlock key values from massive sets of information and interpret them in ways that text or numbers alone cannot. It helps them to uncover fresh insights and focus areas that need further attention.
Moreover, visual presentations help users better understand the context behind the data they’re viewing, which in turn enables them to engage with it more effectively. They’re able to identify patterns, relationships and trends that might be hidden in the data otherwise.
In addition, business meetings that focus on visual data tend to be shorter and more effective, resulting in more productive outcomes. Viewers are also far more likely to feel engaged and motivated when they’re able to relate to the information they’re consuming through data visualizations.
All of this is only possible if all stakeholders have access to self-serve analytics. Traditionally, this process has been conducted via informal tools like Slack and Zoom or formal documentation and BI platforms such as Confluence and Looker.
Embracing Data Science
Data science is no longer an activity that can be done solo, and the success of large data projects has come to depend on collaboration between teams and other organizations. For example, the COVID-19 pandemic pushed law enforcement agencies to use dashboards and reports to increase their situational awareness and allow them to better predict crime and deploy personnel.
When it comes to collaborative data science, replicability is the golden standard. That means that when you change a pre-existing pipeline or model, you can repeat the experiment without significant friction to ensure that you’re not over- or underestimating the impact of your changes.
You can encourage collaboration by promoting a culture of knowledge sharing, which is often best achieved through internal forums or workshops. McKinsey reports that companies who share knowledge see 25% more productivity than those who don’t. Embedding dashboards into commonly used tools like Slack or Salesforce is also an effective way to make data more accessible.
Embracing Artificial Intelligence
In order to achieve true business success, teams need to embrace artificial intelligence (AI) in collaboration with other teams and organizations. This will help to ensure that all employees can work with data in a fast, intuitive, and easy-to-use manner.
AI tools like project management platforms and support chatbots help to improve collaboration by automating repetitive tasks, identifying bottlenecks in workflows, and future-proofing projects against risks. Examples of this are Asana’s ‘Workload Manager’ feature, Trello’s AI-powered ‘Butler’ and Atlassian’s predictive machine learning tools.
In addition, businesses can foster a better understanding of how to work with AI by relating it to their everyday lives and experiences, such as when discussing how AI helps doctors diagnose diseases, self-driving cars navigate roads, or online shopping platforms suggest products. Doing so will help to make AI seem less intimidating and a more valuable tool to enhance and complement humans. Ultimately, this will improve data accessibility and foster a more collaborative, fact-based work culture.


